My Dashboard Design
These are screen captures of my favorite dashboards I have built so far.
Both of them have been adjusted to remove proprietary information.
First Dashboard
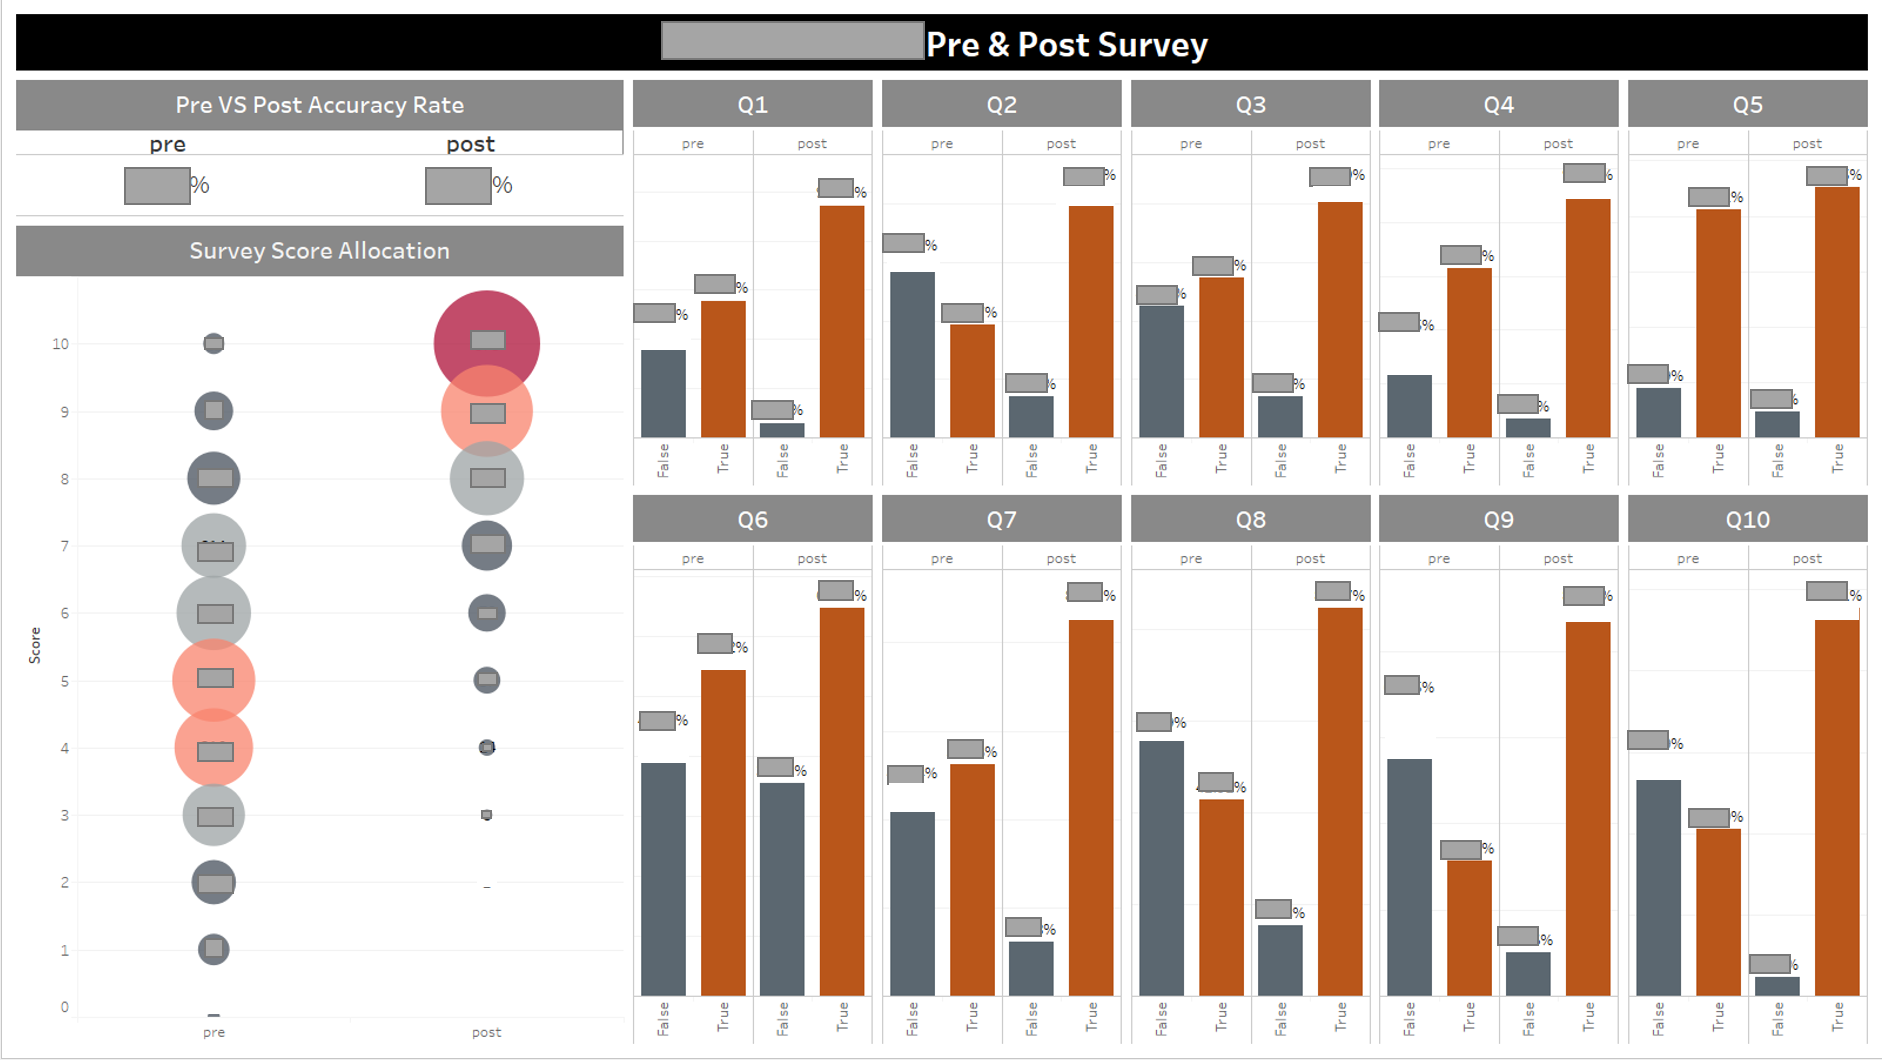
For the dashboard above, I created a chart that noone has ever created before.
Instead of the usual comprison charts, I created an allocation chart (as it showed in the left corner).
This chart represents the distrubution of responses by participants.
It shows a clear image that the score reported during the pre survey falls under an approximately normal distrubution.
The post survey shows significant increase in reported score.
This chart is significantly easier to interprete for non-mathematically inclined audiences.
Second Dashboard
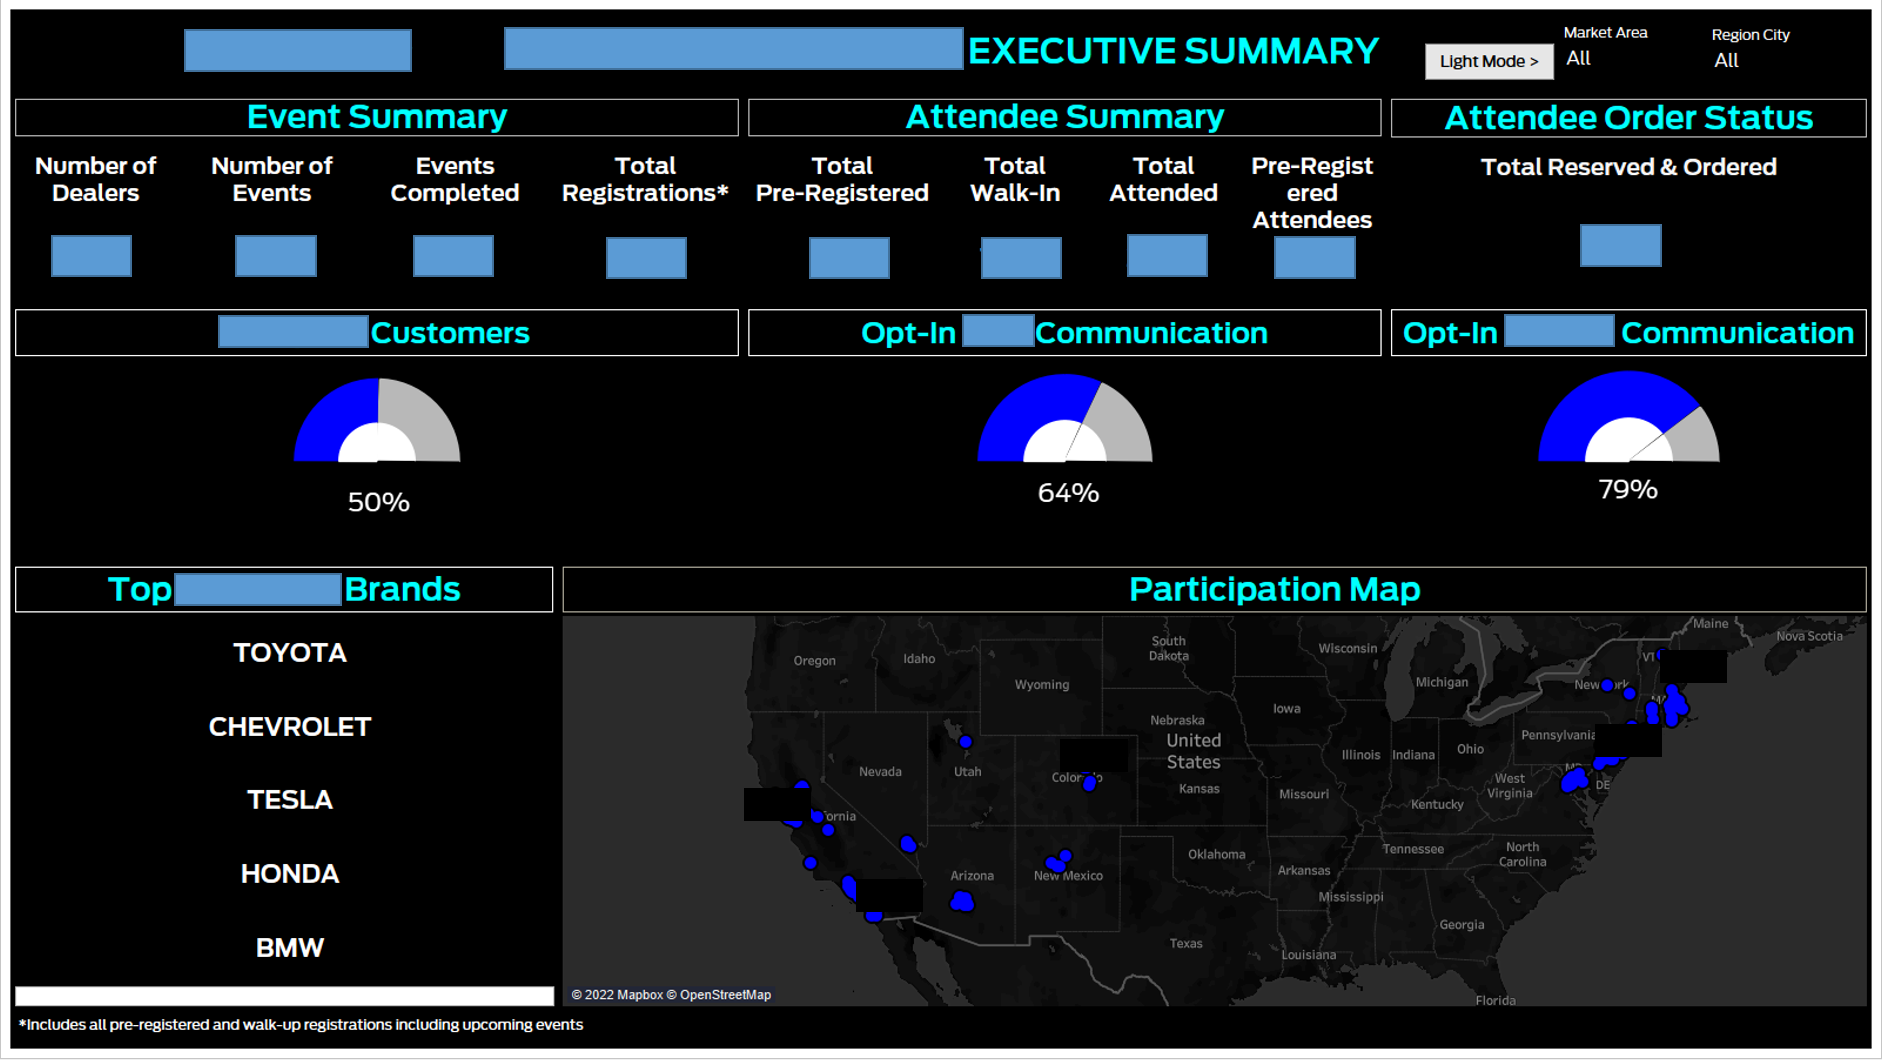
My second dashboard uses black background to represent automotive brand image.
However, considering my viewers needs
I also created a light version to make it printing friendly.
Hitting the light mode button on the top right corner can apply this function (In the interactive dashboard only).
Data shown here includes the basic information my viewers ask for. Additionally, in order to make the dashboard interesting, as well as
represent the automotive brand, I used gauges to show percentages instead of using tranditional methods (such as pie charts, histograms etc.) to accomplish the same task.
Meanwhile, the map on the bottom helps to identify detailed participation.