My Data Solution
Part of my work is to find the relationship between samples and provide insights to my viewers.
All of the results I show below are using random sample data instead of actual real-data set.
Sample t-test
T-test is one of the major testing I have been using. Many places will also uses in A/B testing.
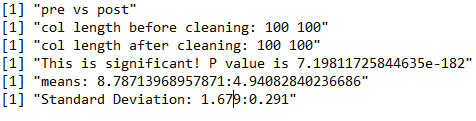
T-test to test if there is significant
different between two sample sets. By checking out p-value,
it is clear to form some kinds of relationship between two independent samples.

The latest diagram I have created is ChordDiagram.
It shows a clean image of the migration of from one value to the other. I usually use it when I want to see how testers mind changing before and after events.
It is really helpful for my non-math viewers to be able to find out the influence of the event.
There is other mathmatical modeling I have used, such as Linear regresion and correlation. Depending on the questions being asked as well as the samples, the math can apply vary. For exmaple, correlation can be very helpful when I want to find the strength between different questions. Linear Regression model can help me figure out how can I predict for the future.